In the year 2020, the world experienced an unprecedented situationーCOVID-19 Pandemic. The world stopped for a while. People were taking utmost measures to prevent the spread by following social-distancing and wearing a mask. A new normal was appearing with work going over zoom calls rather than in-person. In such trying times, one can not stick to the conventional method of usability testing. It also has to go remote.
I worked on polishing some prototypes of the Hand-Interactions. You can learn more about it here. Usability testing is an essential aspect of the iterative development process. Understanding the pain points of interaction helps understand the prototype as well as human kinesthetics.
I believe the future will thrive under the collaborative aspect of Mixed Reality. This means that users worldwide can share a virtual environment, even being remote, and interact with the elements that the space provides. Designing for such a future now is what I aim for.
Glove Hands (Credits: Normcore)
FRAMEWORK
For networking in Unity, I relied on the Normcore networking framework. Normcore provides an easy-to-use datastore network model and avatar voice chat. Such a module solves the central part of networking development.
Being in the same space and having an ability to communicate, now, the framework needs to network the prototypes for coherent interactions in the environment. Hence, changes were made to the prototypes' internal data routing to network feedback, visual updates, and the data optimally. For putting the users in control, I've developed a control panel visible on palm-look interaction. This control panel host commands like connect-disconnect, mute switch, and other logistical information.
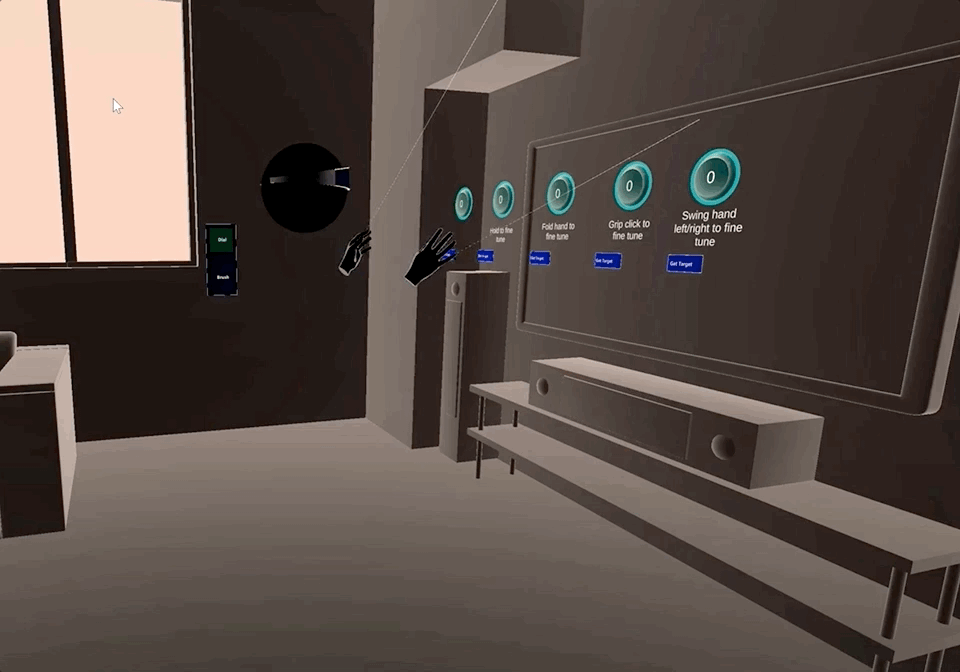
One thing became evident using the generic oven-glove hand-model for the avatar is that they are not informative in usability testing. To a facilitator, it doesn't provide enough data for visually analyzing the actions of the participant. Hence, for these hand-tracking based interactions, I networked finger and hand movements for better visual observations. Seeing hand and finger movements provides an in-depth understanding of how the user perceives the prototype, its affordance, and the failure scenarios. Also, having hands and fingers of a user networked, made the conversation more natural and engaging.
Later on, I appended the hand-rays to the networked environment to understand the participants' far-interaction points.
While working on this project, I developed an editor tool - Parameter Binder to connect and network sync variables. Upon open-sourcing this tool, it received positive comments.
Networked Hands with pointing rays
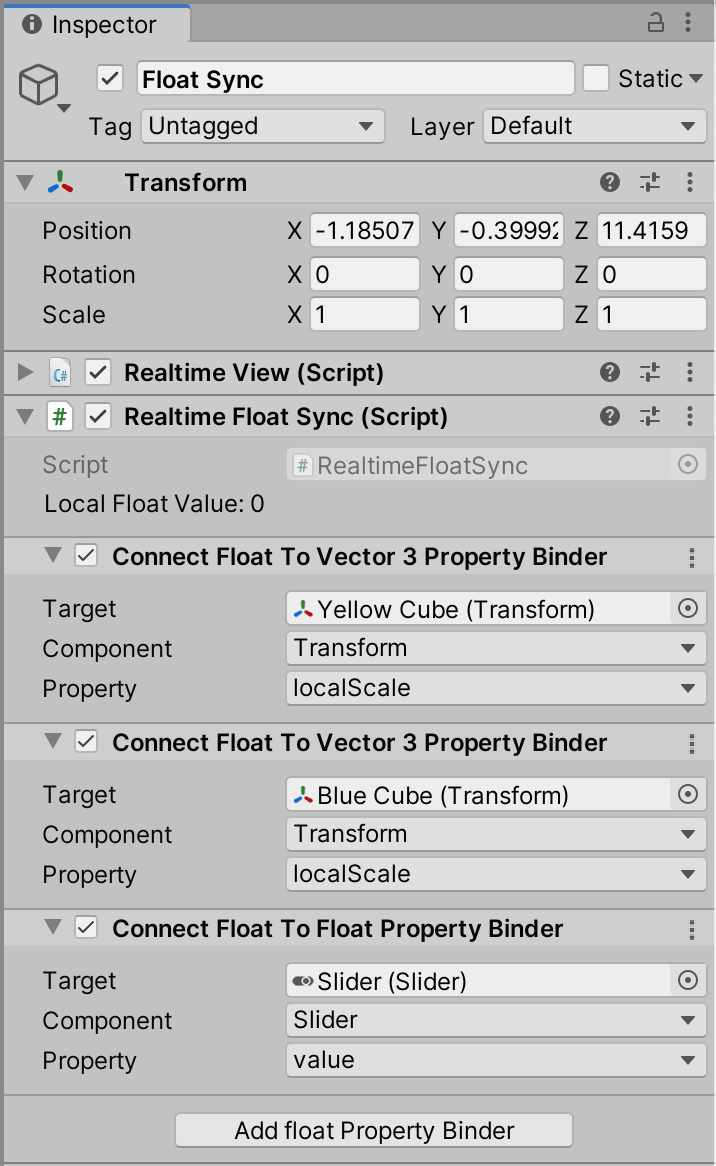
Various binding options for Float variable type
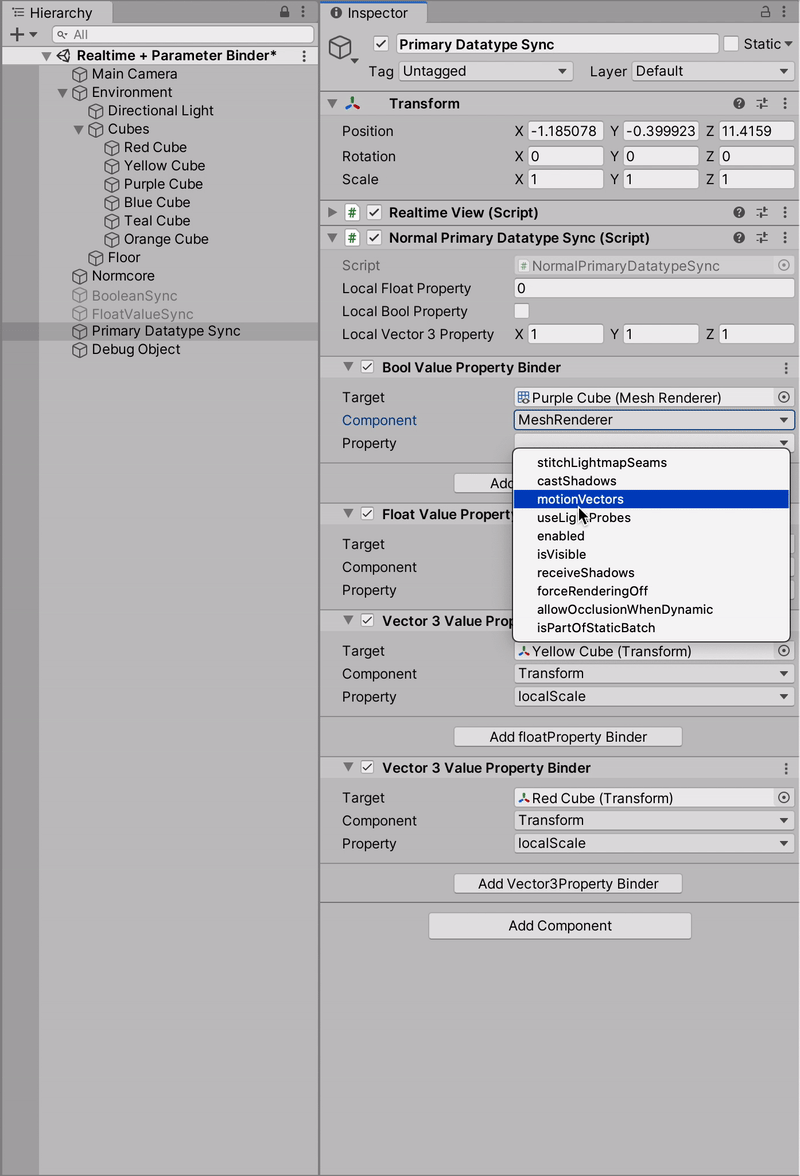
Property Binder for networking various types of variables
DATA COLLECTION
"Above all else, show the data." – Edward R. Tufte.
For quantitative analysis, collecting data is essential. It turned out that it is also the most straightforward step of all. It may be possible that I've used the most direct pipeline. Select the data under consideration, and send it to Google Sheets. Let the Google Sheets do its magic for building charts. Simple!
I've considered recording data like
Dial Prototype:
- Number of times a user has to interact with the dial to achieve a particular target value.
- Interacting hand
- Start value and end value of the interaction
- Time taken to complete the task
Undo-Redo Prototype:
- Interacting hand for the operation of Undo
- Interacting hand for the operation of Redo
- The swing in hand
- Number of failed and successful operations
- Time taken to execute the operation
Along with quantitative data, I have also recorded the conversation, which aids in qualitative analysis. Questions mentioned below helped to iterate over the prototypes:
- Was the interaction confusing?
- Was it feedback differentiable for the action?
- What was the most frustrating moment in completing the task?
- Was it painful to complete the task?
How the collected data helped me iterate over the prototypes?
An instance of data might not help much (unless I'm debugging with printf), but a collection of data tells a lot. Plotting the data and going through the graphs, I identified hidden bugs, the bias in my algorithm, and ergonomics about the interaction. Data also explained many anthropometry theories.
A common conclusion appeared about the handedness and the possible range of movement for an interaction. For example, A right hand's wrist can comfortably rotate 180 degrees clockwise but fail counter-clockwise. Such analysis taught me a lot about the ergonomics employed in the dial.
Some graphs from the recorded data
Another apparent pattern emerging is about the handedness of hand swing in performing Undo-Redo. An outward swing is preferred over an inward swing.
All the conclusion is depended on the amount of data collected. At the moment the data is limited, but a well diverse data (a set which includes various body heights, people with dominant left hand, etc) will provide great insights.
Such explorations also opens door for accessibility interactions as well as ADA compliant interactions.